
Satish Raj Pandey, Shashi Dev Shah
The new year generally brings new hope for everyone. There is an air of optimism when the calendar page is turned. Wishes are exchanged for long life and success. This time, what happened in the 31 days of the first month of the Nepali New Year 2078 has been shocking and heartbreaking. The country is reeling under a devastating surge of COVID-19 cases spread far and wide, causing havoc. In a situation akin to health system collapse, the underprepared health facilities were largely unable to meet the rapidly increasing demand. Unfortunately, valuable lives were lost due to the overwhelmed hospitals overrun by the swelling number of patients with severe symptoms. People were suffocating to death due to a lack of oxygen. In this write-up, we try to quantify this surge and make an effort to provide some details on how the outbreak has unfolded during the month of Baisakh (April 14-May 14, 2021). We want to emphasize as we write this that this is far from over, and Nepal needs to continue to remain very vigilant. All data for Nepal included in this write-up are from the Ministry of Health and Population daily updates.
COVID-19 surge comes home
Nepal was somewhat lucky to have seen a long period of lull as COVID-19 cases remained very low for a long time following the first wave. Life was bearing resemblance of some normalcy. Businesses were starting to feel confident again. Around the beginning of March, in next door India, a hint of a rise in cases started to surface. Before anyone could figure out what was happening the cases surged in an unprecedented manner, and by the end of March, it was already getting very close to the highs of their first wave. In early April, India started to post a record number of cases which continued relentlessly throughout that month, spilling into May.
While the world’s attention was largely drawn towards India’s emerging humanitarian crisis, a largely unaware Nepal was caught off guard. Nepal shares a porous border with India. It was a tall order to escape this new wave that was rampaging through India. Add to this the complacency instilled in the government who thought the “battle was already won” and the people who thought that they have already “overcome COVID-19”. It was business as usual in Nepal, opening up possibilities of many super-spreader events, some political, others social. Some of these were even sponsored by the Government and leading political parties. There were poor preparations widely for any crisis that might be waiting in the wings. This created a perfect recipe for a disaster opening up a great opportunity for this fast and easily spreading virus to make inroads. As a result, Nepal was hit very hard in Baisakh, and the assault by the virus still continues.
As a humanitarian disaster started to unfold in Nepal, it finally caught the attention of the international media. Several leading media outlets and houses such as The Diplomat, National Geographic, The Guardian (at least two write-ups), The New York Times, BBC, and CNN, to name a few, covered the devastation. As the problem spiraled out of control, it forced Nepal’s Prime Minister Mr. KP Oli to resort to writing an opinion piece in The Guardian which included an appeal to help. Covid Alliance for Nepal developed a petition and popularized #vaccine4Nepal to draw the world’s attention to the plight of the Nepali people. As the situation became direr and people were suffocating to death with widespread shortages of oxygen supply, #NepalNeedsOxygen started to trend on social media.
What kind of increase in cases and deaths did Nepal experience in Baisakh vis-a-vis India?
Let us first look at the spread of COVID-19 in India and Nepal. Figure 1 shows that Nepal’s new cases (per 100,000 population) and % positive (of the tests done) saw a meteoric rise, quickly closing the gap with India in May. While Nepal reached 1 case per 100,000 population only on April 11, 2021, India had touched that level much earlier on Feb 25th. Moving on, Nepal witnessed 10 new cases per 100,000 population on April 27, while India had reached it on April 13th. However, Nepal rapidly surpassed India by May 10th. This is doubly concerning if we take into account that Nepal has been testing less than 50% the level of India. (comparing daily tests/100,000 population). Nepal’s 7-day % positive has though Baisakh, remained remarkably higher than India’s as the graph illustrates.
Figure 1:

This surge had a direct adverse impact on mortality. As seen in Figure 2, through April, India’s death/million people was 4-5 times larger than Nepal’s (death/million people). Around May 5th, this gap was closed to half of that and by May 12th, Nepal had already nudged ahead of India with 3 deaths per million population. By May 14th, Nepal’s deaths per million populations stood at 5.5. This demonstrates how overwhelmed the health care system was resulting in an unusually high number of deaths.
Figure 2:

How does Nepal look isolation for Baisakh?
Figure 3 shows Nepal’s exponential growth of new cases and deaths in Baisakh. In one month, Nepal identified 159, 960 new cases from 411,260 tests (RT-PCR) conducted. This gives a monthly yield of 38%. The consistently high yields show that the virus was widely spread and that the testing was largely inadequate. At the beginning of the month, the cases per million population were only 19 cases/million but by the end of it had swiftly moved to 284 cases/million. To compare with the first wave, the high for 30-day new cases was 95,160 between Oct 7-Nov 5, 2020.
Figure 3:

Nepal carried out 21,161 Antigen tests in Baisakh out of which 2,812 tested positive. This write-up, however, doesn’t include data related to Antigen testing. This was done to make it comparable with the previous wave and to ensure the percent positive calculation is consistent.
Nepal registered its highest single-day percent positive (50.2%) on May 10th. Of all the cases identified in Nepal from the start of the pandemic, 36.3% of the cases were identified in this one month alone. This month registered 15.4% of the total tests carried out to date. In the last week of Baishak alone, 5.1% of the total cumulative tests so far were done and 14.2% of the total cumulative cases were identified.
Sadly, 1,611 lives were lost in Baisakh. This is 34.5% of the total cumulative deaths. The last week of the month accounted for 23.3% of the total cumulative deaths thus far. As a comparison, November had recorded the highest 571 monthly deaths during the first wave. This explosion of deaths shows that Nepal is facing urgent humanitarian situation right now.
How does week on week data look?
Table 1 shows that weekly cases against the previous week accelerated when compared against the increase in weekly tests from April 10 – April 30. Notably, this pace of increase was somewhat stable in the last two weeks. This provided some faint glimmer of hope of a possible slowdown. During the month, average deaths per day continued to increase reaching 134/day in the last week. Apart from increasing deaths resulting from overburdened health facilities, this could partly be because of the adjusted data that now takes into account the additional bodies managed by Nepal Army. These adjustments have been made in the past several days. It is evident that the “law of the large numbers” played out in Nepal and a very rapid increase in cases resulted in an unprecedented level of deaths.
Table 1:

What about testing?
For most of Baisakh, the increase in testing came from the private labs and from tests within the Kathmandu valley although cases were surging across the country (Figure 4). It was only in the last two days of the month that the seven-day average of tests from the government labs surpassed the private labs. For the first week of the month, the testing level in the government labs was around half of the private labs. This reached around 70% by May 1st. Looking at it another way, we can summarize that at the beginning of the month, the government labs were doing only around 37% of total daily tests nationally. This increased to 40% by May 1st and only by May 13th the government-run labs were doing 50% of the national daily tests. This is important because tests from the government-run labs have no cost barriers as they are all free while the private labs charge at least Rs 2000 per test.
Figure 4:

Similarly, at the beginning of the month, 72% of the total national tests were being done only in the Kathmandu valley. By May 1st, this dropped to 63% and reached parity by May 13th as tests were finally increased up outside the Kathmandu valley. As the percent positivity was extremely high outside Kathmandu valley, the ramping up of tests outside Kathmandu valley was slower than required. (Figure 4)Table 2 shows the 7-day average for percent positive for the labs within the Kathmandu valley and outside. The percent positive outside the valley had started to go up two weeks before Baisakh. In the week of April 6, the % positivity average had already reached 11%. This was a sign of the development of a serious situation. The average quickly spiraled out of control and remained above 45% for the last three weeks of the month.
Table 2:

In Kathmandu valley, the % positivity average reached above 10% around the first week of Baisakh (week of April 13) and reached 40% by the third week of the month. Although the situation was worsening both within and outside Kathmandu valley, tests were relatively ramped up only in Kathmandu valley for most of Baisakh.
The testing level in some provinces were far from required level despite the Provinces carrying the potential to be hot-spots for new cases.
Figure 5:

As demonstrated in Figure 5, Province 2 and Lumbini, constantly recorded much lower than the national average for tests/100,000 population. Their ratio remained very low throughout the month and the increase was woefully slow. This might have been a big missed opportunity because as shown by Table 3, the percent positive province was already in double digits as early as four weeks before Baisakh in Lumbini and three weeks before Baisakh in Province 2. Gandaki, Karnali, and Sudurpaschim provinces, too, had consistently shown >10% positivity three weeks before Baisakh but still had very low levels of testing. This shows a disproportionate burden of percent positivity and a relatively low level of testing outside the Kathmandu valley.
Table 3:

Who was being infected?
Age-specific new infections were assessed for Baisakh against the previous period (Table 4). Marginally more new infections (as the proportion of the total cases) were seen among age categories above 40 years of age compared to the same groups in the previous period. Contrary to the common belief, the new infection proportions were not higher among the younger population than in the previous months. This perception might have been created by the generally higher totals for new infections. This meant that there was a relatively higher absolute number of new infections across almost all age groups.
Table 4:

Impact on the health care system
The rapid increase of new cases caused a higher number of hospitalizations to need in a very short time. As a result, hospitals were suddenly seeing an overwhelming number of cases requiring the care for moderate to severe symptoms. Active cases nationally swelled by more than 26 times in just one month moving from 4000+ at the beginning of Baisakh to more than 100,000 by the end of it. By the accounts of the Ministry of Health and Population, Nepal, people in ICU care and on ventilators increased by more than 15 times within the month. As a result of this exponential growth, there were 371 people on ventilator care by end of Baisakh (Figure 6).
Figure 6:

Has the vaccination have any impact so far?
At the time of writing this, through two rounds of Covishield roll out and one round of Vero Cell (Sinopharm), Nepal had administered single doses to nearly 5.7% of the population. Those that had received Covishield vaccines in the first round, mostly healthcare and other frontline workers, have also received their second dose. As a result, around 1.2% of the population is now fully vaccinated. The second dose for the Vero Cell vaccine is being provided from May 16, 2021.
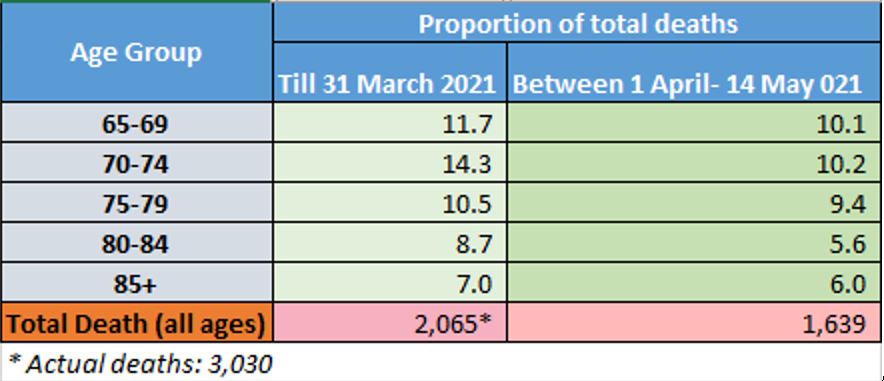
As the vaccine coverage so far is extremely small, it is understandable that a large proportion of the population is still unprotected. This can explain the high hospitalization and deaths the surging cases are causing. It is useful to see if the vaccination is having any positive impact among the population already vaccinated. In order to carry out a very rough indirect assessment, we looked at mortality data for the 65+ age group who were provided the first dose of Covishield vaccines in the second round of vaccination drive. This round had coverage of more than 60% of the target set and was completed on March 16th. We divided total national deaths for a period before April 1 and after April 1 to date. We chose April 1 with the understanding that by then, two weeks of vaccination would have elapsed for those vaccinated in the round. So although vaccinated only with a single dose, we tried to indirectly assess if the ones vaccinated were protected more.
There was no access to mortality figures only for the vaccinated cohort. Due to this, we looked at age-specific mortality contributions for all age groups at the population level. We observed that after April 1, the age-specific deaths among the people 65+ years old as a percent of total deaths saw a marginal decline. (Table 5) Although not conclusive due to the absence of sound statistical analysis of this observational finding, this might still give some very early clues that vaccination may be working to reduce deaths. This should be investigated further.
Moving ahead
Nepal, as with most low-resource settings, suffers from constraints to carry out adequate crucial genome sequencing to study the presence of different variants. As we have seen in the UK and parts of India, variant B.1.617 can muscle out other variants to be the dominant one in circulation in a very quick time. This is the reason WHO recently categorized B1.617 as a variant of concern (VoC). Using proxies from India, we can hypothesize that currently, the dominant variant in Nepal might also be B 1.617.2. This is supported to some extent by Nature in its May 14, 2021 article which states the following:
In early May, (Dibesh) Karmacharya’s team sequenced 12 samples from people recently infected in the Kathmandu valley — including himself. Eleven of the sequences were of B.1.617, and one was of B.1.1.7. The results are only a tiny snapshot of what is circulating, but are still “a little scary”, says Karmacharya.
We have seen the havoc caused in India with the variants in circulation. Due to the nature of the B1.617 variant, many countries including the UK have shown a very high concern. Regardless of which variant, we can be assured that the variant (s) circulating in Nepal is (are) also spreading aggressively. This can be due to the high infectiousness of the variant that thrives in the environment with poor exposure population-level behavior. Some experts have speculated the R(naught) number for variant B1.617 to be very high. Even societies of high vaccine coverage have opened up with a lot of caution. We need to remain mindful of this possible high transmissibility and should remain very vigilant.
The restrictions/lockdown are currently imposed in 74 out of 77 districts of Nepal. The slowdown of growth (not a marked decline yet though) in new cases we are witnessing might be because the lockdowns have been in place for more than two weeks. If non-pharmaceutical interventions are not implemented during and post lockdown, the surge can easily bounce back as soon as the restrictions are lifted. Our vaccination coverage is very low and a new tranche of vaccines might not arrive soon enough to counter the current wave. Those vaccines might only be handy to face the next wave which experts have predicted to be inevitable.
In the meantime, preventive measures are crucial to stemming the spread of the virus. It is also essential for the Covid-19 response in Nepal to ramp up testing, especially from the government facilities for areas outside the Kathmandu valley. This will make testing more accessible to a wider population. In addition, the government should reduce the cost of testing from private labs.
What we have witnessed over the past month has been both heartbreaking and extremely concerning. This is still far from over and we shouldn’t let our guards down. All forces should continue to join hands in raising the voice in the international area for more support, particularly for items such as testing supplies, oxygen supply related support and anything that aids to further ramp up hospital capacity in an urgent manner. We should continue to appreciate the work of the health care workers and others who have tirelessly helped and saved lives in this distressful time. Let us hope that Nepal will be able to prevent a further rise in the number of deaths and also dramatically reduce the new cases to a manageable level by the end of the next month, Jestha, Baisakh has surely been a month to forget. We shouldn’t, however, forget what got us in a terrible position, to begin with. Let us have the resolve to not repeat those mistakes.
Stay safe, Nepal!
Posted by Satish Pandey at 11:54 AMNo comments: Email ThisBlogThis!Share to TwitterShare to FacebookShare to Pinterest
Friday, November 20, 2020
COVID19 in Nepal: Now that the world “has” vaccines, are we safe?
Satish Raj Pandey, Shashi Dev Shah
Almost 11 months after @promed_mail sent this email (below) alerting the world about “pneumonia of unknown cause” in Wuhan, China, the world has recorded, by the time we write this, close to 57 million known infections out of which nearly 1.4 million (2.4%) have died due to COVID19 pandemic (JHU Coronavirus Update Center). While this pandemic has been highly politicized and has been extremely polarizing, these numbers, which look to continue to grow for the foreseeable future, can’t be brushed off as not significant. The mental shock, personal trauma, and economic devastation this has caused are of such magnitude and wide-ranging that they simply can’t be ignored.

The past few days have brought us very mixed news regarding the future of the pandemic. On one hand, the world recorded, for the first time, more than half a million daily cases, moving swiftly on to more than 600,000 daily cases coupled with daily deaths exceeding 10,000 (Worldometers). Many countries, including very affluent ones, are under the scourge of a new surge of cases and deaths. It had momentarily looked like deaths were coming under control only for the overwhelmed health facilities to again record rising cases of deaths. This paints a very sobering picture of the time we are living in. However, this is not to say that all is gloomy. We have had some really exciting news coming out of the several candidate vaccines showing very promising results from their Phase 2 and/or Phase 3 trials.
It is very heartening to see that, for this extraordinary plight faced by the world, scientists around the world have worked at breakneck, unprecedented speed, oftentimes even competing against each other, to present to the world a bright prospect of vaccines being available (soon) to fight the pandemic. From the recent results seen, it is increasingly looking like the existence of a vaccine is no longer a matter of if but now a matter of when, and more importantly, immediately for whom. This light at the end of a very depressing tunnel has brought much-awaited cheers to many. While making the vaccine might end up being the easy part of getting everyone vaccinated, we still need to celebrate these moments because the bright scientists of this world have put us all on the path of being able to win this war in the long run.
While the world was waking up to exciting breaking news about these candidate vaccines and their high efficacy, WHO Director-General, Tedros Adhanom Ghebreyesus was warning the world that “A vaccine alone will not end this pandemic.” The point he was trying to make, as he should, was that, due to limited supplies, the initial supply of the vaccines will be prioritized (rightly) for those most-at-risk to reduce the deaths. This means that the rest of the world will have to wait. He emphasized that as we wait, all of those tools that we know to work such as surveillance, testing, isolating, early treatment, contact tracing, and community mobilization, to name a few, need to be continued. This is not a time to let our guard down.
This means that each country needs to be focused on what is best to contain the spread of the virus until its population, at least the critical mass to begin with, has access to the vaccine. For this to be effective, experts need to be engaged so that we can understand better where the epidemic is going within the country and what kind of initiatives will give the most bang for the buck until vaccines are available for everyone.
This article makes an effort to outline some critical data regarding the current situation of COVID in Nepal. We are trying to do this because during the Dashain and Tihar festivals the daily reported cases have seemingly gone down. This, along with this euphoric news about vaccine breakthroughs, can give a false sense of security to the people and make them let their guards down. We have to realize this pandemic is far from over and in fact, has entered into a very dangerous phase and will remain as that until vaccines are more widely available. The only word we can repeat for people is caution, caution, caution.
So let us see what our COVID19 situation looks like. Some of the tables presented here will have testing and new case data segregated for Kathmandu valley and outside Kathmandu valley. This is done because, as you can see from the data, the cases and testing seem to be evenly divided between the valley and the rest of the country. We hope that this will help understand the situation better and will prevent dilution of the national figures by Kathmandu valley related data. Please also take note that while some graphs use daily numbers others use a seven-day average. This distinction is necessary to understand the data better. All data for Nepal shown in this article is taken from the Ministry of Health and Population daily updates.
Where are we with testing and positive percent?
Testing is the backbone of the COVID19 response. We have to admit that after a slow start, thanks to the Nepal government’s efforts, testing (RT-PCR) did get scaled up rather well through most of October. The seven-day average even crossed the 16,000 mark during this month. While it falls short of the government’s claim that the country can carry out more than 22,000 tests per day, this increase has enabled us to identify cases both in and outside the Kathmandu valley. We can see (Chart 1) that testing in Kathmandu valley surpassed the testing done in the rest of the country around the third week of September and has since remained above the rest of Nepal level. Testing in Kathmandu hit a high of more than 9000 (seven-day average) in the middle of October but since then has dropped to below 5,000. Similarly, testing outside the valley exceeded 7,000 in the third week of October but has now dropped to below 3,000. We can see that the slump is mostly related to the festival season and can hope that it will increase again now that the festivals are over.

Chart 1: Seven-day moving average test and yield -National, Kathmandu Valley, and out of Valley.
We can see (Chart 1) that the overall percent positive (also known as yield) for Nepal had hovered above 20% since the second week of October. This is very alarming. In the past two weeks, yield in Kathmandu valley has constantly remained above that of the rest of the country. What gives some ray of hope is that the yield in the rest of the country seems to be moving towards the 20% mark from a high of 25% at the end of October.
Who is doing these tests?
We looked at the RT-PCT tests by government and private facilities for both Kathmandu valley and out of the valley. What we see from these charts is the tests from government facilities are constantly going down. We can observe (Chart 2) that almost all of the increase in testing mentioned earlier for October happened in privately-run labs in Kathmandu valley. The majority of the tests being done out the valley are still done by the government-run labs, and the share of private labs have remained mostly constant through October and November. The entire nation has seen a massive slump in testing during the festival season. The drop is more pronounced in the government-run labs. This is very concerning because most people who need support to get tested rely on these government labs and these dwindling numbers can only mean that their tests are vastly delayed or never take place. There is an urgent need for the government labs to start testing close to their capacity and let the number of tests to continue to slide.

Chart 2: RT-PCT tests in Kathmandu Valley and tests positive, by government and private labsChart 3: RT-PCT tests out of Kathmandu Valley and tests positive, by government and private labs
What are we finding from these tests?
We have said that the overall tests in the valley and the yield from the tests have remained above the rest of the country. This, naturally, has caused the new case numbers in the valley to be above the rest of the country. The new cases found were on an increasing trend in both Kathmandu valley and outside the valley (Chart 4). One notable observation from Chart 1-4 is that the only time both yield and number of cases seemed to be going down, despite the number of tests remaining constant, is the short period around 2-3 weeks after the lockdown. This gives a hint that the lockdown might have been somewhat bringing the spread under control despite the economic hardships it caused. We can see from the high yields and high number of new cases the spread becoming uncontrolled following that short period.
During the festivals, the drop in new cases is seen to commensurate with the drop in testing indicating a slightly more stable yield (albeit still above 20%) for both these geographical regions. The drop in the COVID19 new cases during the festival should be seen strictly as a drop in overall testing. As mentioned before, there are some bright spots that the drop in cases outside the Kathmandu valley seems to be slightly steeper than the fall in testing. We need to observe testing results from after the festivals to see if these are real drops and if we are rounding a corner there.

Chart 4: Seven-day moving average of new cases and RT-PCT tests done (Kathmandu valley and outside)
Chart 5: Daily new cases in three Kathmandu valley districts and the rest of Nepal
What does the overall testing yield and cases found to tell us?
WHO sets standards to know if the spread of the virus in a country is in control. It is desirable that for countries with adequate testing that the overall daily tests/positive case found remains above 10, or better still, even above 20. It may be true that the initial spread of the virus in Nepal mostly took place among returnee migrants, either infected before they arrived or presumably infected due to poor conditions of the quarantine facilities. It is clear (Chart 6) that around the end of August the spread had established deeper roots through the local transmission. The experts had raised the red flag several times about this which was mostly ignored. The spread in the community, therefore, continued unabated causing the tests done to find each positive case to drop below 10 and even below 5 since 7th Oct (with very few exception). Again, this is an area of grave concern. Chart 6: Daily tests carried out per new positive case found
Who is being infected?
The above theory about increasing local transmission can be seconded by an alarming reality that the proportion of older people among the newly infected was growing every day. This population is presumed to be less mobile and mostly confined to their homes. It appears that they are being infected by the younger members of the family who bring the virus home. The share of the 60+ population among all newly infected increased by more than double to 8.1% by Nov 19 compared to 3.9% by Aug 27 (Chart 7). The number of 60+ age group in this period increased 14 times compared to 5.7 times in the younger population. For a disease known to affect the elderly disproportionately more (from severity of the disease and mortality perspectives), this shift is again an area of major concern.Chart 7: Shift in proportion of COVI19 cases by age groups
But are people dying?
Yes, people are dying. This is a short answer to the question. The long answer is that the overall deaths have started to grow considerably since around the beginning of September and have gone worse in the second half of October and November. We are constantly losing (officially) more than 15 people at a minimum almost every day. This coincides with the shift of the infection in the older age group. Protecting our older population has to be a priority as they are more vulnerable to succumbing to this virus. We can see that most growth in new cases were seen between Oct 9-Oct 29th and the deaths have started to increase around two weeks after this period. This lag time in deaths increase is very common.
It is also to be noted that the government had revised its guidelines to stop requiring COVID19 testing on the deceased if the status was unknown before the death even though they are highly suspected and symptomatic to COVID19 . If we assess this in the backdrop of the widespread practice of home isolation, it can be safely assumed that a significant number of COVID19 related deaths might be being missed. We tried to corroborate this by assessing what proportion of deaths before the change in the guidelines was tested positive after the person’s demise and we found that until Sept 2, 23% of the total people who died were diagnosed AFTER their death. The recent news articles that mention a much higher number of bodies ‘managed’ by the Nepal Army’s dead body management team also support this notion that COVID19 related deaths in Nepal are now vastly under-reported.Chart 8: COVID19 Daily Deaths (National)
But isn’t our case fatality ratio very low?
Our case fatality ratio (CFR), based on new cases and mortality figures shared by the Ministry of Health and Population stands at 0.6%. This is much lower than the global average mentioned at the start of the article. As with most averages, a more granular look at these deaths will give us a different picture. As many as 30 districts and 3 provinces now have CFR higher than the national average. This tells us the dangers of having this virus freely circulated in the general population. A large number of people can still die if the spread is not checked on time.

Chart 9: COVID19 Case fatality Ratio, by district, province and National
What should we be looking at?
We have seen from around the world that when the health care system can’t cope with the increasing load of the cases, people die and die at higher rates. This has been witnessed even in the most affluent of counties. This is the reason countries keep a very close eye on hospitalization rates and doubling time of ICU enrollments. Patients on the ventilators is another indicator countries look at to understand if they are approaching capacity or not. The entire idea is to prevent the hospitalizations to overwhelm the system so that lives can be saved. We looked at the number of patients in ICU and on ventilator support in both Kathmandu valley and nationally. The overall number of patients in ICU has grown through November till this day. The patients on ventilator support were seen to be alarmingly going up until the second week of November and for now, have remained at a relatively lower level. We can’t help but notice that this may be inching back up as we emerge from the festivals.

Chart 10: COVID19 patients in ICU or under ventilator support
Conclusion
The spread of COVID19 is far from over, globally, and in Nepal. This is not the time for any complacency. The COVID case increase in Nepal hasn’t relented. It is still spreading fast. Deaths are also not abating and as the increasing number of the older population get infected, the country is sitting on a time bomb poised for a higher level of deaths if left unchecked. Pinning hopes solely now on a vaccine that is still going to remain out of reach for months can have catastrophic consequences. The country needs to continue to fight against the virus.
People should avoid indoor crowded spaces, need to use a mask at all times, stop holding gatherings of all sizes (dinners, parties, and the likes), remain within your bubble and not overlap as much as possible, maintain social distancing, ventilate your rooms well, isolate responsibly if you are in close contact of the infected, buy a Pulse Oximeter or donate one to those that can’t afford, seek treatment from a professional promptly and stop stigmatizing those that have presumably tested positive.
In the meantime, the government should channel its energy to prepare the country for the vaccines. They should work with the GAVI COVAX Advance Market Commitment (AMC) to ensure that vaccines are secured for the country to the level the mechanism allows. The country should ensure that our share of financing for the vaccines is worked out ahead of time. Finally, while the vaccines are being produced, the country should immediately start putting measures in place, working closely with international/national experts, to develop the protocols, infrastructure, and distribution mechanisms in place so that the vaccines can be rolled out in a timely and equitable manner as soon as they become available.
This is a fast-spreading virus. It has been infecting the world at a very rapid rate. Even if vaccines become available quickly, no one is safe until everyone is safe. The safety of the world lies in how quickly and how widely the vaccination is applied while other safety non-pharmacological intervention measures are continued to be used to complement. Nepal can’t be looking at its recent seemingly reducing COVID19 cases as it is confounded by the festivals and resultant low testing. It should focus all its energy on keeping its population safe until the vaccines become available and then, distribute the vaccine among its population in a speedy and equitable manner. Only this will make Nepali safer. Until then, we aren’t safe, not just as yet.
This article was originally published here.

